 Tue, 19 May 2026
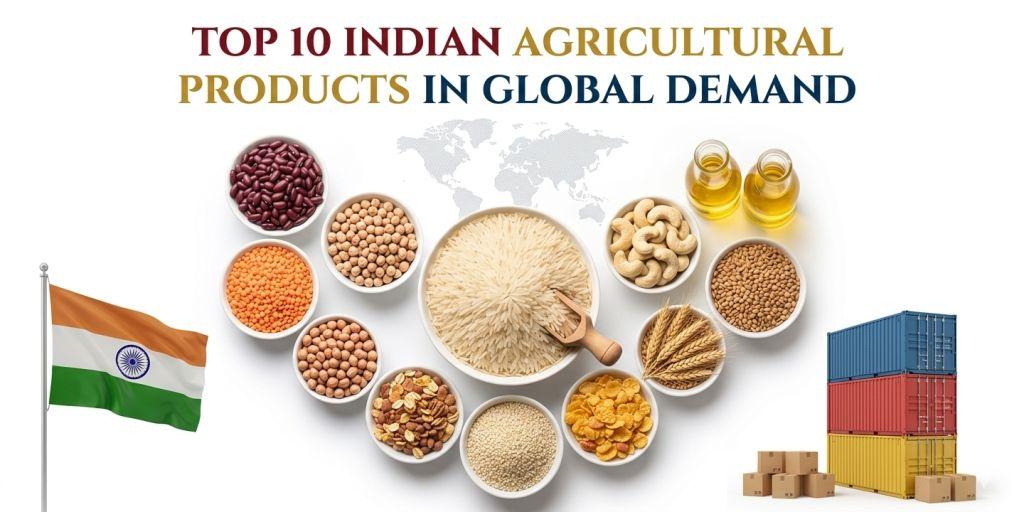
Top 10 Indian Agricultural Products in Global Demand


India surpassed China in 2024 to become the world's largest rice producer. Let that land for a second. A country with a population of 1.4 billion people - with domestic demand that would seem to absorb everything - produced 150 million tonnes of rice, more than any other country on earth.
And then it exported 21.55 million metric tonnes of it. That is nearly three times what Thailand exported. Nearly three times Vietnam. When India's 2023 export restrictions triggered a 15-year high in global rice prices - confirmed by the FAO - it told the world something important: India is not just a large agricultural country. It is, in multiple categories, the marginal supplier that sets the price.
That dynamic plays out across more than just rice. India's spice exports crossed $4.52 billion in FY25. Its coffee exports hit an all-time record of $1.81 billion - up 40% in a single year. Marine product exports reached $7.45 billion. The total agricultural export basket came in at $52 billion in FY25, growing 6.4% year-on-year at a time when overall merchandise exports grew just 0.1%.
This is not a secondary export sector. It is the one that grew fastest when everything else was flat.
The guide below covers the 10 agricultural products that drive this - what each one is worth, who buys it, what the current export situation looks like, and what any buyer or exporter needs to know.
India's Agricultural Export Overview
Before the top 10, the big picture:
| Metric | Value |
|---|---|
| Total agri exports FY25 | $52 billion |
| YoY growth FY25 | +6.4% |
| Q1 FY26 agri exports | $5.96B (Apr–Jun 2025), +7.1% YoY |
| H1 FY25-26 total | $25.9 billion, +8.8% YoY |
| Processed food share of agri exports FY25 | 20.4% (up from 14.9% in FY18) |
| Top buyers | USA, UAE, China, Bangladesh |
| APEDA export target | $100B by 2030 |
The processed food share jump - from 14.9% to 20.4% in seven years - is the structural story inside the headline numbers. India is not just shipping raw commodities. It is exporting increasingly value-added product. That is a more defensible position and a higher-margin one.
Sources: IBEF, APEDA, Ministry of Commerce & Industry (PIB India)
1. Rice - The Product That Moves Markets
FY25 export value: $12.95 billion FY25 volume: 20.1 million tonnes (rising to 21.55 MT in 2025 calendar year) Global rank: #1 exporter
India does not just dominate rice exports. It defines them. When the government banned non-basmati white rice in July 2023, global prices hit a 15-year high. One country's domestic policy moved world markets. That is the kind of supply position very few agricultural exporters hold in any commodity.
The ban is over. All restrictions - non-basmati white rice, minimum export prices, the broken rice ban - were lifted by March 2025. The result: calendar year 2025 exports jumped 19.4% to 21.55 million metric tonnes, the second-highest on record. Basmati hit an all-time record of 6.4 million tonnes. Non-basmati jumped 25% to 15.15 million tonnes.
Looking forward: IREF projects 23.5 million tonnes for FY2025-26. The USDA puts the number even higher at 25 million tonnes. India's FCI was sitting on 33.59 million tonnes of rice stocks in November 2025 - more than three times the government's buffer norm. With storage overflowing and no export restrictions in sight, the trajectory is up.
What the market actually buys:
Basmati - premium, aromatic, long-grain. Top buyers: Saudi Arabia (61.2% of basmati volume comes from the top five Middle East markets combined: Saudi Arabia, Iraq, Iran, Yemen, UAE). Also UK, US, and Europe for diaspora retail. Basmati trades at a significant price premium over non-basmati and is India's highest-value rice export.
Non-basmati - bulk volume, competitively priced. Africa dominates: Benin, Guinea, Côte d'Ivoire, Togo, and Bangladesh together took 44% of non-basmati export volumes in 2024-25. The price is what drives demand here. India is competitive on non-basmati because its surplus stocks keep prices below competitors.
Export pathway: APEDA registration required. HS code 1006 (rice). No current export restrictions.
→ India Agriculture & Food Exporters on Navi Exports
2. Marine Products - India's Largest Agri Export by Value
FY25 export value: $7.45 billion (Rs 62,408 crore) FY25 volume: 16,98,170 metric tonnes Global rank: Top 5 globally; fastest growing in H1 FY26 at +17.4%
Marine products - primarily frozen shrimp - are India's single largest agricultural export category by value. That surprises many people who think of India as a terrestrial farming nation. But the numbers are clear: $7.45 billion in FY25, with US and EU as the dominant buyers.
The US imported Indian seafood worth over $966 million in just April-July FY26. EU imports reached Rs 9,430 crore ($1.125 billion) in FY25, led by shrimp, cuttlefish, and squid. The coastal states of Andhra Pradesh, Gujarat, West Bengal, Tamil Nadu, Kerala, Maharashtra, and Odisha drive production.
The big development for marine exports: the India-UK FTA grants India 100% duty-free access for seafood, removing tariffs of up to 21.5% on shrimp, lobster, and squid. Tamil Nadu has set a $5 billion seafood export target specifically driven by this opening.
India's marine products also benefit from the PM Matsya Sampada Yojana - a $9 billion government investment in the fisheries sector over five years. Infrastructure investment that directly improves export quality and volume.
What buyers care about: HACCP certification, MPEDA registration, FDA registration for US buyers, EU equivalency standards. Cold chain infrastructure is the main limiting factor for growth, and government investment is specifically targeting this.
Export pathway: MPEDA registration mandatory. HS codes 0302-0307 range.
→ India Fish and Sea Food on NaviExports
3. Spices - India Is the World's Pantry
FY25 export value: $4.52 billion (some sources report $4.72B including derivatives) Global rank: #1 producer, #1 exporter, #1 consumer - simultaneously
India produces 75 of the 109 spice varieties listed by the ISO. It is the only country that is simultaneously the world's largest spice producer, exporter, and consumer. That combination is remarkable. It means the domestic base keeps production expertise continuously sharp, while the export volume supports infrastructure that most competing countries simply do not have.
Spice by spice, the FY25 picture:
- Chilli: highest volume, $1.34 billion (price-corrected; volume jumped 19% to 7.15 lakh tonnes)
- Cumin: $732 million, up 5% - India dominates global cumin supply
- Cardamom: up 53% to $184 million - premium pricing intact
- Turmeric: surged 51% to $341 million, driven by curcumin demand in health markets globally; India targets Rs 8,549 crore ($1B) in turmeric exports by 2030
- Pepper: up 40% to $124 million
- Spice oils and oleoresins: $535 million, up 8% - used in food processing, pharmaceuticals, and cosmetics globally
India exports to 200 countries. China, USA, UAE, Bangladesh, Thailand, Malaysia, UK, Saudi Arabia, Germany are among the top buyers. US food manufacturers use Indian cumin in Tex-Mex blends, Indian chilli in hot sauces, Indian turmeric in supplement capsules. These are not specialty imports anymore. They are mainstream industrial food ingredients sourced from India at scale.
The credibility challenge: a 2023 food safety episode involving certain Indian spice brands created scrutiny in Hong Kong and Singapore. The response from the Spices Board - increased testing protocols, mandatory FSSAI compliance verification - has been the right one. Buyers now expect documentation more rigorously. Exporters who have that documentation have a clean competitive advantage.
Export pathway: Spices Board registration mandatory. FSSAI compliance for food safety. HS codes 0902-0910 range.
→ Indian Spices on NaviExports
4. Buffalo Meat (Carabeef) - India's Quietly Dominant Export
FY25 export value: ~$3 billion+ Global rank: #1 exporter globally
This is the agricultural export that surprises people most consistently. India is the world's largest exporter of buffalo meat - and by a significant margin. The product is carabeef (water buffalo), not beef; bovine slaughter laws vary by state, but buffalo processing is legal across most of India at commercial scale.
The production is concentrated in Uttar Pradesh, primarily Aligarh and surrounding districts. Processing facilities are APEDA-certified and FSSAI-compliant for export. The product is predominantly frozen boneless carabeef.
Top destinations: Vietnam, Malaysia, Iraq, Egypt, Hong Kong, Indonesia, Saudi Arabia. Southeast Asia and the Middle East are the dominant markets. Vietnam imports Indian buffalo meat for domestic consumption and re-processing. The Gulf countries buy significant volumes for halal consumption.
The export grew from essentially zero thirty years ago to $3+ billion today. It is one of India's most successful agricultural export stories - built without the name recognition of rice or spices, without a dedicated government board, without international marketing campaigns. Just supply chain efficiency and competitive pricing.
What the market needs: FSSAI certification, APEDA registration, halal certification for GCC buyers, veterinary health certificates per destination country. Cold chain is essential and established.
→ Fresh Meats / Beef / Pork / Lamb on NaviExports
→ Meat and Poultry Products on NaviExports
5. Cotton - Raw, Yarn, and the Value-Add Gap
FY25 combined exports (raw + yarn + fabric): ~$11.5 billion Global rank: #2 cotton producer; #1 in cotton yarn global market share (31.2%)
India's cotton export story needs to be understood in three distinct segments, because they behave differently:
Raw cotton: India produced 29.42 million bales in FY25 - the world's largest. Bangladesh takes over 90% of raw cotton exports, importing to feed its garment industry. The challenge: Indian raw cotton has been priced 7% above the global Cotlook A-Index in recent seasons, making domestic processing more competitive than export for some buyers. Raw cotton export volumes dropped significantly in MY 2024-25 as a result.
Cotton yarn: This is where India's global position is genuinely commanding - 31.2% global market share. Bangladesh and China are the main buyers. Crisil forecasts 7-9% revenue growth for India's cotton yarn sector in FY26. The revised GST on cotton inputs is supporting cost competitiveness.
Cotton fabrics and home textiles: The US takes 29% of Indian cotton fabrics. Bangladesh ($160M), Sri Lanka, Germany, and UK are major buyers. Home textiles - bed linen, towels, curtains - are a significant and growing segment.
The Kasturi Cotton Bharat programme - blockchain-based traceability for Indian cotton using QR-coded bales — is India's answer to the sustainability credibility question. Major Western retailers increasingly require traceable, sustainably-sourced cotton. Kasturi Cotton positions Indian raw material at the premium end of that conversation.
Export pathway: IEC, Cotton Corporation of India registration for raw cotton, RCMC from TEXPROCIL for fabrics and yarn. HS codes 5201-5212 range.
→ Find all category of Yarn Thread Cotton
→ Cotton Yarn Silk Yarn Synthetic Yarn Wool Yarn
6. Spice Oils, Castor Oil, and Oilseeds - The 90% Market Share Category
Castor oil FY25 export value: $850M+ (India holds ~90% of global castor oil supply) Key markets: USA, EU, China, Japan
Castor oil is India's most dominant agricultural export position - not just competitive, but genuinely monopolistic. India controls approximately 90% of global castor oil production and export. The US, EU, China, and Japan cannot meaningfully substitute: castor grows primarily in Gujarat's semi-arid climate, and scale production elsewhere takes decades to develop.
Castor oil's applications span bioplastics, lubricants, pharmaceuticals, cosmetics, and paints. Demand is growing specifically because of its role in bio-based industrial chemistry — as chemical industries move away from petroleum-based inputs, castor oil's profile as a renewable alternative improves.
Beyond castor, India's oilseed exports include:
- Groundnuts (peanuts): major export to Southeast Asia and EU
- Sesame: growing premium market in Japan, South Korea, EU
- De-oiled rice bran: used in animal feed, exported to Vietnam and Japan
Export pathway: APEDA registration, standard phytosanitary certificates per destination.
7. Coffee - The Record That Changed the Conversation
FY25 export value: $1.81 billion (all-time record, +40% YoY) FY26 progress (Apr–Oct 2025): $1.176 billion, +12% YoY Global rank: 7th largest producer
For most of India's history, coffee was an afterthought in the export conversation - a product dominated by Brazil and Vietnam that India participated in modestly. That perception is outdated.
FY25's $1.81 billion was a 40% jump from FY24 in a single year. That kind of growth does not happen from routine demand. It happened because Vietnam's Robusta crop underperformed badly in 2024, and India — a consistent, quality Robusta supplier - absorbed the volume that buyers needed. Italy, Belgium, Germany, Russia, and the US are the top buyers of Indian coffee, primarily for Robusta that goes into European espresso blends.
Karnataka produces 70% of India's coffee. Kerala and Tamil Nadu contribute most of the rest. Indian Robusta is not a niche specialty - it is a mainstream industrial input for European espresso manufacturers.
The trajectory in FY26 is continuing at +12%. The single-origin specialty coffee trend is also creating a premium lane for Indian coffee beyond industrial Robusta - Araku Valley coffee from Andhra Pradesh has won international recognition.
What buyers are increasingly asking for: Single-origin certification, sustainable farming credentials, traceable supply chains. Coffee Board of India is the registration and certification body.
→ Export Coffe from Navi Exports
8. Tea - Steady Premium, Growing Specialty
FY25 export value: $920 million FY26 progress (Apr–Oct 2025): $605.90 million, +15.16% YoY FY25 production: 1,284.7 million kgs (April-December 2024) Global rank: #2 producer
India drinks most of its own tea - and that has historically kept export volumes lower than production volumes suggest. But the tea that does export commands a premium. Darjeeling's GI protection means it competes against Champagne and Parmigiano-Reggiano in the category of geographically protected premium products. Assam is the backbone of most British tea blends. Nilgiri supplies European specialty blends.
The +15.16% growth in H1 FY26 is the strongest performance in years and reflects two things: a global shift toward specialty and wellness teas (organic green tea, herbal infusions, masala chai) where Indian brands have natural advantages, and the India-UK FTA removing trade friction in India's historically most important export market.
Top buyers: UAE, Germany, Russia, USA, UK, Iran, Netherlands.
The honest challenge: Kenya and Vietnam undercut India on commodity-grade tea. The only sustainable play for Indian tea exporters is origin branding and premium positioning - which the Tea Board is supporting with specific certification frameworks. Exporters who compete on commodity price with East African producers will find it difficult. Exporters who can tell an origin story (Darjeeling first flush, Assam single-estate, organic Nilgiri) are in a completely different conversation.
9. Fresh Fruits and Vegetables - The Fastest-Growing Segment
FY25 export value: Growing ~25% year-on-year Key products: Mangoes, grapes, onions, pomegranates, bananas, potatoes Key markets: UAE, UK, Netherlands, Malaysia, Bangladesh
Fresh fruits and vegetables are where India's agricultural export story gets interesting for the next decade. Processed food's share of total agri exports has risen from 14.9% in FY18 to 20.4% in FY25. Fresh produce — properly cold-chained, quality-graded, and documented - is the next layer of that value-add story.
The headline numbers: India is the world's second-largest vegetable producer and second-largest fruit producer. It has barely scratched global export potential given this production base.
What is moving:
Mangoes - India produces over 40% of the world's mangoes. The US has emerged as the largest export market for Indian mangoes, with Kesar overtaking Alphonso in US consumer preference. Phytosanitary certification and USDA-approved hot water treatment are required for US access.
Grapes - Maharashtra's Nashik grapes export to Europe, SE Asia, and the Middle East. EU food safety standards are the main compliance hurdle; meeting GlobalGAP certification opens European retail.
Onions - India periodically restricts onion exports to control domestic prices. When restrictions lift, India floods global markets. The UAE, Malaysia, Sri Lanka, and Bangladesh are major onion buyers.
Bananas - Burhanpur in Madhya Pradesh produces approximately 15% of India's total banana output; the region exported about 70,000 metric tonnes in 2025.
Floriculture - India's fastest-growing fresh agri export category. Roses, chrysanthemums, marigolds exported to Europe and the Middle East. Cold chain infrastructure is the constraint.
The cold chain challenge is real. India loses an estimated 16-18% of fruit and vegetable production to post-harvest losses annually - one of the highest rates among major agricultural producers. Government investment through PM Dhan-Dhaanya Krishi Yojana (₹24,000 crore outlay from FY26) specifically targets post-harvest infrastructure. As this gap closes, fresh produce export potential is significant.
→ Find Fresh Fruits on NaviExports
→ Find Fresh Vegetables on NaviExports
10. Processed Food and Value-Added Agricultural Products
FY25 export value: ~$10B+ (20.4% share of total agri exports) Growth trajectory: Consistent 7-9% CAGR over seven years Key products: Processed vegetables, fruit pulp and concentrates, packaged spices, ready-to-eat, baby food, organic certified products
This is not a single product - it is a category that represents where India's agricultural export sector is heading. Processed food exports grew from $958 million in FY2019-20 to $1.8 billion in FY2024-25 (processed fruits and vegetables alone). The processed food share of total agri exports has risen consistently.
What is driving it:
Organic food: India is the world's largest organic producer by number of farmers. Certified organic exports - primarily to the EU and US - are growing at strong rates. APEDA manages organic certification recognition under the National Programme for Organic Production (NPOP).
Ready-to-eat and ethnic food: The South Asian diaspora in the US, UK, Canada, UAE, and Australia creates baseline demand. Mainstream mainstream consumers in these markets are following. Indian ready-to-eat products — dal makhani in retort pouches, biryani kits, chutneys - are in Costco, Tesco, and Whole Foods.
Fruit pulp and concentrates: Alphonso mango pulp is the best-known; India also exports tomato paste, guava pulp, and mixed tropical fruit concentrates used in beverage manufacturing globally.
Baby food and infant nutrition: Emerging export category, particularly for the Middle East.
Export pathway: APEDA registration, FSSAI compliance, destination-market food safety certification (FDA for US, EC regulations for EU, SFDA for Saudi Arabia).
→ Fresh Organic Produce on NaviExports
What Competitors Miss
Most "top 10 agricultural exports from India" articles make the same three mistakes:
They use stale data. If an article does not mention India surpassing China to become the world's largest rice producer in 2024, or the 40% jump in coffee exports in FY25, or the 17.4% marine export growth in H1 FY26, it was not written from current sources. Stale data in agricultural export contexts can mean misaligned expectations for buyers and exporters both.
They ignore the export policy dimension. Indian agricultural exports cannot be discussed without discussing the policy reality: rice had a 14-month ban that was fully lifted; sugar operates under quota; wheat is still restricted (though surplus stocks suggest this may change); onion exports are periodically restricted. Buyers who do not account for this risk planning supply chains around products that may not be available for export in a given season.
They treat every product the same. Rice at $12.95 billion requires a completely different buyer relationship, documentation set, and supply chain than castor oil at $850 million or fresh mangoes at scale. The compliance pathway for a marine product exporter (MPEDA, HACCP, FDA, EU equivalency) is nothing like the pathway for a spice exporter (Spices Board, FSSAI, phytosanitary certificates). Grouping them as "India's top agri exports" without this distinction gives readers a list, not knowledge.
Government Support Bodies for Indian Agricultural Exporters
APEDA (Agricultural and Processed Food Products Export Development Authority) Primary body for fruits, vegetables, processed food, meat, poultry, dairy, basmati rice, and several other categories. Manages quality standards, export promotion, market development, and capacity building. Registration mandatory for APEDA-scheduled products. → apeda.gov.in
MPEDA (Marine Products Export Development Authority) Handles certification, QC, and promotion for seafood exports. Mandatory registration for all marine product exporters. → mpeda.gov.in
Spices Board of India Certifies and promotes spice exporters. Registration mandatory for spice exports. → indianspices.com
Coffee Board of India → indiacoffee.org
Tea Board of India → teaboard.gov.in
National Turmeric Board (newly established) India's target is Rs 8,549 crore ($1 billion) in turmeric exports by 2030 - retaining 58-66% global market share. The National Turmeric Board is the institutional mechanism driving this.
PM Matsya Sampada Yojana ₹20,000 crore ($2.4 billion) government scheme for fisheries infrastructure - cold chains, processing units, port-side facilities. Directly supports marine export capacity building.
PM Dhan-Dhaanya Krishi Yojana ₹24,000 crore outlay from FY26 to enhance productivity, irrigation, credit access, and post-harvest facilities for 1.7 crore farmers across 100 districts. Addresses the cold chain and post-harvest loss problem that limits fresh produce export potential.
How to Connect With Indian Agricultural Exporters
For international buyers:
- Use verified B2B platforms - Navi Exports lists verified Indian agri exporters across food, commodity, and processed food categories: Agriculture & Food Exporters | Commodity Exporters
- Contact APEDA for their database of registered exporters by product category
- Attend APEDA-organized international Buyer-Seller Meets in target markets
- International food trade shows: Gulfood (Dubai, February), SIAL Paris (October biennial), Anuga (Cologne, October biennial), PLMA Amsterdam (private label)
For Indian exporters:
- Register with APEDA, MPEDA, Spices Board, or other relevant body
- Get IEC from DGFT
- Ensure product-specific certifications: phytosanitary for fresh produce, HACCP for seafood, FSSAI for processed food, organic certification if claiming organic
- List on Navi Exports to reach international buyers directly
Related Navi Exports Categories
- Agriculture & Food Exporters
- Commodity Exporters
- Animal Products Exporters
- Confectionary & Beverages
- Textile Products & Fabric
The Bottom Line
India's agricultural export story in 2025-26 is not a single headline. It is ten different headlines running simultaneously.
Rice broke records as the world's largest producer and lifted all export restrictions. Coffee had its best year ever, absorbing Vietnam's supply gap. Marine products grew 17.4% in the first half of FY26. Turmeric surged 51% on global wellness demand. Tea grew 15% with the India-UK FTA opening new doors.
And processed food quietly expanded its share of the total basket from 14.9% to 20.4% over seven years - which is the structural story that matters most. India's agricultural exports are not just growing in volume. They are growing in value, moving up the processing chain, and getting harder to substitute.
The $100 billion APEDA target for 2030 requires roughly 13% annual growth from the current $52 billion base. That is ambitious. It requires cold chain investment that is underway but incomplete, policy stability that has been inconsistent, and market development in Africa and Southeast Asia that is happening but slowly.
The underlying agricultural production base is there. The variety, the scale, the cost competitiveness - these are real. The question is execution on the processing and logistics side. Judging by the trajectory of the last five years, the direction is right.
→ Browse verified Indian agricultural exporters on Navi Exports
Data sources: IBEF Agriculture Sector Report (October 2025), APEDA Export Data FY25-26, Ministry of Commerce & Industry PIB releases, IREF (Indian Rice Exporters Federation) FY26 projections, Reuters (rice export data January 2026), The Print (rice export forecast November 2025), Coffee Board of India FY25-26 data, Tea Board of India H1 FY26, MPEDA Marine Products FY25, Spices Board of India FY25, PMF IAS India Farm Exports Analysis (November 2025), FAO Global Rice Price Index data, USDA Foreign Agricultural Service World Agricultural Supply and Demand Estimates.
Frequently Asked Questions
India's top 10 agricultural exports by value in FY25: (1) Rice - $12.95 billion; (2) Marine Products - $7.45 billion; (3) Spices - $4.52 billion; (4) Buffalo Meat - ~$3 billion; (5) Cotton and cotton yarn - $11.5 billion combined with textiles; (6) Castor oil and oilseeds - $850M+ for castor alone; (7) Coffee - $1.81 billion (record high); (8) Tea - $920 million; (9) Fresh fruits and vegetables - growing 25% YoY; (10) Processed food and value-added products - ~$10B+ at 20.4% of total agri exports.
The largest buyers of Indian agricultural products in FY25 were the USA, UAE, China, and Bangladesh. The US dominates for marine products, spices, and coffee. UAE is the key market for basmati rice and processed food. Bangladesh is the primary buyer of raw cotton and non-basmati rice. China buys marine products, cotton yarn, and some agricultural inputs.
Yes. India is the world's largest rice exporter by volume - and by a large margin. In 2024-25, India exported 20.2 million metric tonnes; calendar year 2025 exports rose further to 21.55 million tonnes. India exports nearly three times more rice than Thailand, the second-largest exporter. India also surpassed China to become the world's largest rice producer in 2024-25, with 150 million tonnes of production.
By global buyer demand signals in 2025-26: rice (all restrictions lifted, record projections ahead), marine products (shrimp specifically, growing 17.4% in H1 FY26), coffee (all-time high after Vietnam supply gap), turmeric (up 51% on wellness demand), fresh mangoes and grapes (fast-growing with diaspora and mainstream crossover), and organic certified food products (growing in US, EU, Japan).
It depends on the product: APEDA registration for fruits, vegetables, processed food, meat, and rice. MPEDA registration for marine products. Spices Board registration for spices. FSSAI compliance for all food products. For the US: FDA registration and US-specific food safety documentation. For the EU: EC food safety compliance, organic certification recognition under NPOP-EU equivalency. For organic claims: NPOP certification or NOP (US) certification. For fresh produce: phytosanitary certificates from the Plant Quarantine authority per destination country's requirements.
Navi Exports lists verified Indian agricultural and food exporters across categories - from fresh produce to processed food to commodities. Browse the Agriculture & Food and Commodity categories. APEDA's registered exporter database at apeda.gov.in is the most comprehensive government-maintained directory. APEDA also organizes international Buyer-Seller Meets in target markets where pre-qualified exporters meet international buyers.